
Elasticity measures how strongly one variable responds to another: price elasticity of demand (PED) is the percentage change in quantity demanded divided by the percentage change in price, and income, cross and supply elasticities follow the same "percentage change over percentage change" shape — so the bubble-tea PED of −0.5 worked below means demand is price-inelastic. Ancourage Academy teaches elasticity in its JC1 H2 Economics programme as a calculation first and an argument second, because the 9570 syllabus uses it to explain revenue and expenditure and to judge taxes and subsidies. For the wider course picture, see the H2 Economics JC guide.
Ancourage Academy's JC1 H2 Economics classes run in small groups of 3 to 6; book a trial class (usually $18) to start with a diagnostic of where your child stands.
What Does the 9570 Syllabus Say About Elasticity?
The Singapore Examinations and Assessment Board (SEAB) syllabus for H2 Economics (9570) lists four elasticities — price elasticity of demand, income elasticity of demand, cross elasticity of demand and price elasticity of supply — and names two jobs for them: explaining market outcomes and judging government intervention.
The 2027 H2 Economics syllabus (9570) places elasticity in Theme 2.1. Point 2.1.2g reads: "These outcomes can be affected by price elasticities of demand and supply, income and cross elasticities of demand". The outcomes it refers to, in 2.1.2f, are "equilibrium price and quantity, consumer expenditure, producer revenue, consumer surplus and producer surplus". Point 2.1.3c adds that the "Impact of government intervention on markets may be affected by price elasticities of demand and supply".
The Concepts and Tools list gives the exact terms to use: "Price elasticity of demand", "Income elasticity of demand" ("Normal and inferior goods"), "Cross elasticity of demand" (with "Complements and substitutes") and "Price elasticity of supply". The syllabus does not prescribe a calculation method, and it says "Knowledge of ‘incidence’ in relation to taxes and subsidies is not required", which shapes how a tax answer should be written (see the essay section below).
The syllabus sets Paper 1 as two compulsory case studies of 30 marks each (60 marks, 40%) and Paper 2 as three essays from six (75 marks, 60%), each paper lasting 2 hours 30 minutes. Pacing is covered in the H2 Economics essay and CSQ technique guide.
What Are the Four Elasticity Formulae?
Every elasticity is a ratio of two percentage changes, with the responding variable on top and the cause underneath. A percentage change is (new value minus old value) divided by the old value, multiplied by 100.
| Elasticity | Formula in words | What the sign or size tells you |
|---|---|---|
| Price elasticity of demand (PED) | % change in quantity demanded of good X ÷ % change in price of good X | Negative for a normal downward-sloping demand curve. Size above 1 = price-elastic; below 1 = price-inelastic; exactly 1 = unitary |
| Income elasticity of demand (YED) | % change in quantity demanded of good X ÷ % change in income | Positive = normal good; negative = inferior good. Between 0 and 1 = necessity; above 1 = luxury |
| Cross elasticity of demand (XED) | % change in quantity demanded of good X ÷ % change in price of good Y | Positive = substitutes; negative = complements; close to zero = largely unrelated |
| Price elasticity of supply (PES) | % change in quantity supplied of good X ÷ % change in price of good X | Positive for an upward-sloping supply curve. Above 1 = price-elastic; below 1 = price-inelastic |
A note on sign. Because price and quantity demanded move in opposite directions, a PED calculation produces a negative number. Many textbooks drop the minus sign and compare the absolute value with 1; others keep it. Follow your JC's convention. For YED and XED the sign is never dropped, because the sign is the whole classification.
How Do You Calculate PED and What Does It Mean for Total Revenue?
When demand is price-inelastic, a price rise increases total revenue; when demand is price-elastic, a price rise reduces it. The numbers below are illustrative.
Illustrative data: a bubble tea shop raises the price of a cup from $4.00 to $5.00. Weekly sales fall from 800 cups to 700 cups.
- Percentage change in quantity demanded = (700 − 800) ÷ 800 × 100 = −12.5%.
- Percentage change in price = (5.00 − 4.00) ÷ 4.00 × 100 = +25%.
- PED = −12.5 ÷ 25 = −0.5.
- Classify. The absolute value, 0.5, is less than 1, so demand is price-inelastic over this range.
- Total revenue before = $4.00 × 800 = $3,200. After = $5.00 × 700 = $3,500. Revenue rises by $300.
The interpretation sentence a case study answer needs: "Since PED is −0.5, quantity demanded falls proportionately less than the rise in price, so the shop's total revenue rises, from $3,200 to $3,500." It names the value, the classification, the proportional reasoning and the revenue direction.
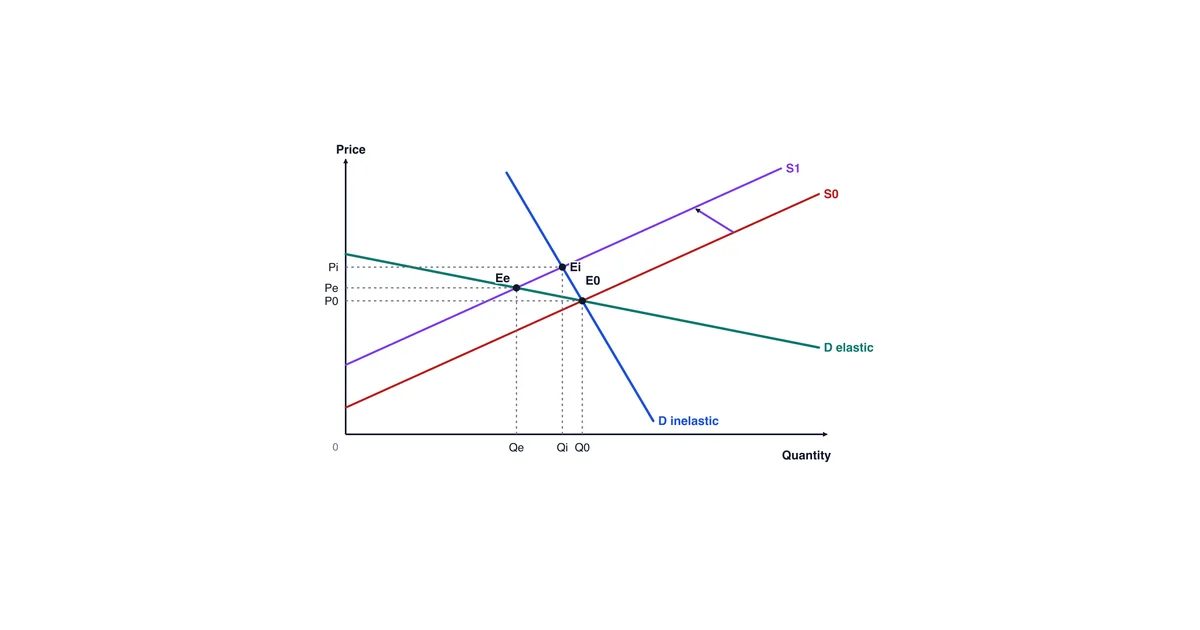
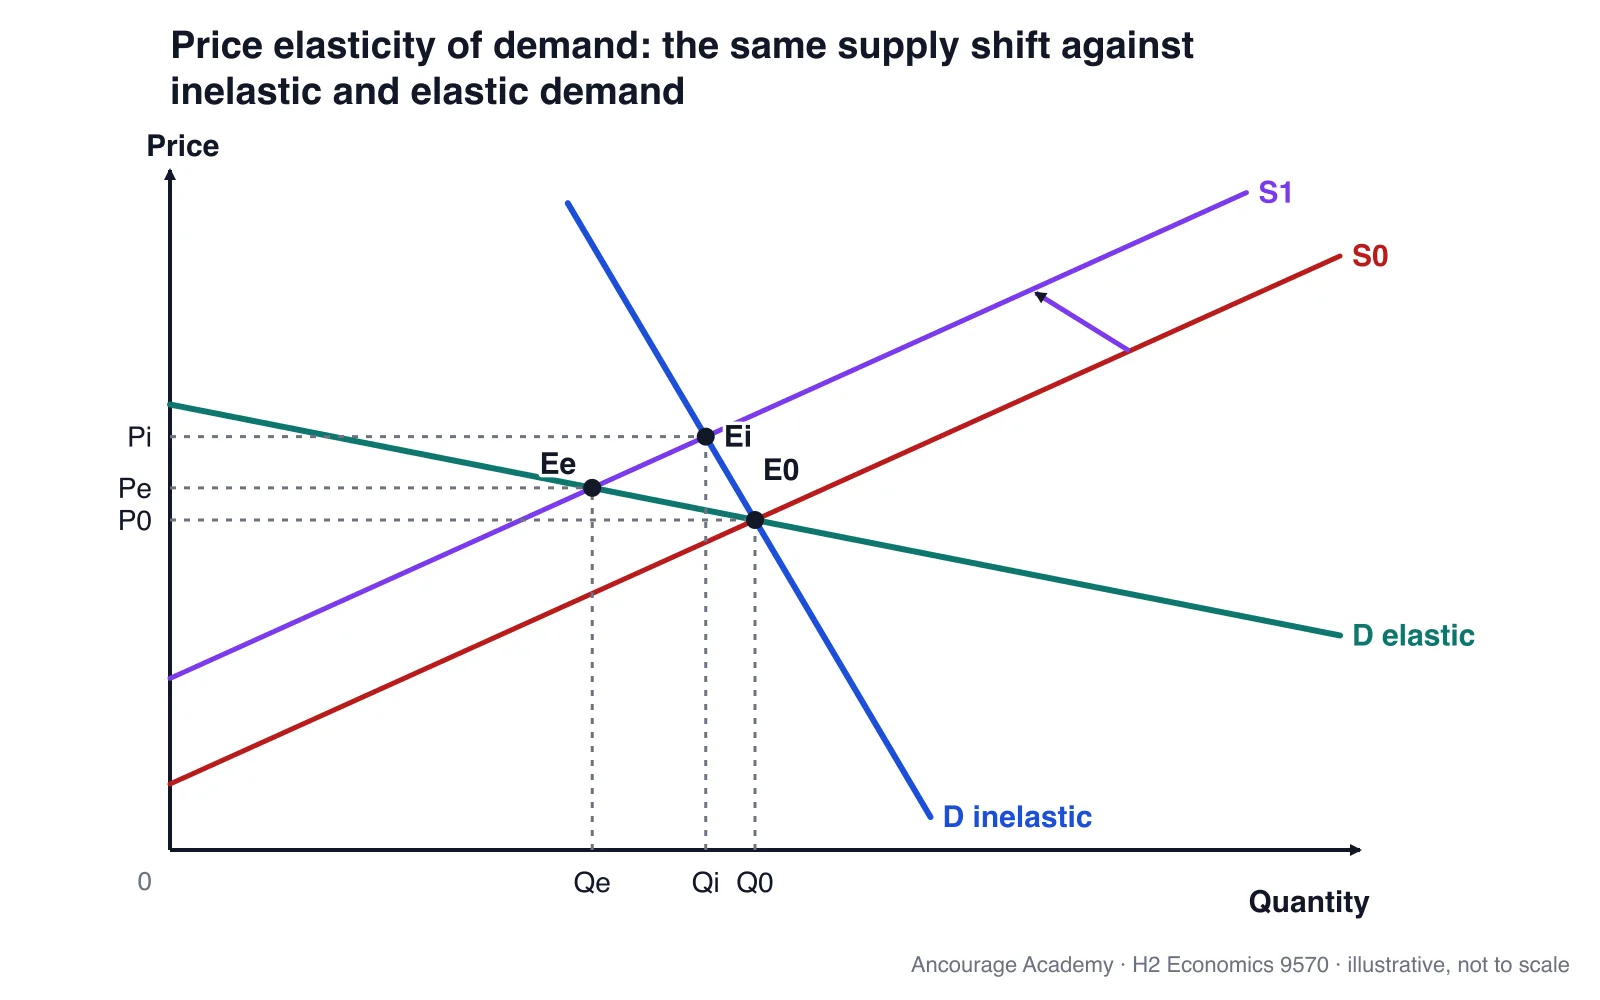
Consumer expenditure and producer revenue are the same figure seen from the two sides of the market. The same logic sits behind firms' pricing in Theme 2.2, where the syllabus names "third degree price discrimination": a firm that can separate buyers charges more to the group whose demand is less price-elastic. Figure 1 below, also in the H2 Economics diagram atlas, labels the price and quantity at each point, so each revenue rectangle P × Q can be read straight off it.
How Does YED Separate Normal, Inferior, Necessity and Luxury Goods?
The sign of YED tells you whether a good is normal (positive) or inferior (negative); the size of a positive YED tells you whether it behaves like a necessity (between 0 and 1) or a luxury (above 1). The syllabus names normal and inferior goods; necessity and luxury is a standard textbook refinement.
Illustrative data: a household's monthly income rises from $5,000 to $5,500, a rise of 10%. Its monthly purchases change as follows.
| Good | Quantity before | Quantity after | % change in quantity | YED (÷ 10%) | Classification |
|---|---|---|---|---|---|
| Restaurant meals | 20 | 25 | +25% | +2.5 | Normal good, income-elastic (luxury) |
| Rice (kg) | 10 | 10.4 | +4% | +0.4 | Normal good, income-inelastic (necessity) |
| Instant noodles (packs) | 30 | 27 | −10% | −1.0 | Inferior good |
The interpretation sentence: "With YED of +2.5, demand for restaurant meals rises more than proportionately with income." In a case study, YED links a macro fact in the extract, such as rising incomes, to one market.
How Does XED Tell Substitutes From Complements?
A positive XED means the two goods are substitutes; a negative XED means they are complements; and the larger the absolute value, the closer the relationship.
Illustrative data, substitutes: the price of Brand A coffee rises from $5.00 to $5.50 (+10%). Weekly demand for Brand B coffee rises from 400 to 460 cups (+15%). XED = +15 ÷ +10 = +1.5. Positive, so substitutes, and close ones.
Illustrative data, complements: the price of a coffee-capsule machine rises from $200 to $250 (+25%). Monthly demand for capsules falls from 1,000 packs to 900 (−10%). XED = −10 ÷ +25 = −0.4. Negative, so complements, with a fairly weak link.
Always state the direction: XED is the response of good X to the price of good Y, and reversing the goods gives a different figure.
Why Does PES Rise Over Time?
Supply is usually more price-elastic in the long run than in the short run, because firms need time to hire workers, add machines and expand capacity.
Illustrative data: the price of bottled cold-brew coffee rises from $3.00 to $3.60 (+20%) after a surge in demand.
- Within one week, output rises from 5,000 to 5,300 bottles (+6%). PES = 6 ÷ 20 = 0.3, so supply is price-inelastic: firms can only run existing machines longer and sell from stock.
- After six months, output rises from 5,000 to 7,000 bottles (+40%). PES = 40 ÷ 20 = 2.0, so supply is price-elastic: firms have added equipment and staff.
The interpretation sentence: "Supply is price-inelastic in the short run (PES 0.3) but price-elastic after six months (PES 2.0), so output responds far more once firms can expand capacity."
What Determines Each Elasticity?
In standard texts the main determinant of PED is the availability of close substitutes, and the main determinant of PES is time. The syllabus does not list determinants; the table gives those standard texts use.
| Elasticity | Determinant | Effect on elasticity |
|---|---|---|
| PED | More, and closer, substitutes | More price-elastic |
| PED | Larger share of income spent on the good | More price-elastic |
| PED | Good is a necessity or habit-forming | Less price-elastic |
| PED | Longer time to adjust | More price-elastic |
| YED | Degree of necessity of the good | Necessities lower positive YED; luxuries higher |
| PES | Spare capacity and stocks held | More price-elastic |
| PES | Ease of moving factors of production into the industry | More price-elastic |
| PES | Length of the production period, and time allowed | Longer time allowed, more price-elastic |
In an answer, tie the determinant to the good: "demand for cigarettes is price-inelastic because smoking is habit-forming and there are few close substitutes", not just "demand is price-inelastic".
How Is Elasticity Used in a Case Study Answer?
In a case study, elasticity work has three steps: calculate a value from the data, explain the outcome it implies, and judge how far the data can be trusted. Assessment objective AO2 covers the last step: "Make valid inferences based on the information presented and its limitations."
Illustrative extract. Table 1: Cinema chain Z, a hypothetical Singapore operator.
| Indicator | Year 1 | Year 2 |
|---|---|---|
| Average ticket price | $12.00 | $13.20 |
| Tickets sold | 50,000 | 48,000 |
| New streaming service launched | No | Yes |
| Household income index (Year 1 = 100) | 100 | 104 |
(a) Calculate the price elasticity of demand for chain Z's tickets between Year 1 and Year 2. The percentage change in quantity is (48,000 − 50,000) ÷ 50,000 × 100 = −4%. The percentage change in price is (13.20 − 12.00) ÷ 12.00 × 100 = +10%. PED = −4 ÷ 10 = −0.4, so demand appears price-inelastic.
(b) Explain what happened to chain Z's total revenue. Revenue rose from $600,000 ($12.00 × 50,000) to $633,600 ($13.20 × 48,000): with price-inelastic demand, tickets sold fell proportionately less than the price rose.
(c) Comment on the reliability of your estimate. The calculation assumes ceteris paribus, but incomes rose by 4%, which raises demand for a normal good and holds sales up, and the new streaming service is a substitute that cuts demand. The −0.4 figure therefore mixes price, income and substitute effects, and cannot be read as the true PED. A sound answer names the further data that would settle it, such as sales at other chains over the same period.
A fully worked market-failure case study, built the same way, is in the market failure worked CSQ and essay.
How Do You Apply PED in an Essay on an Indirect Tax?
An indirect tax on a good with price-inelastic demand raises substantial tax revenue but reduces consumption by comparatively little, so it is stronger as a revenue measure than as a way to cut consumption. Singapore Customs lists tobacco products among its four categories of dutiable goods, alongside intoxicating liquors, motor vehicles and petroleum products, which makes cigarettes a natural example.
A model paragraph for a Section A essay:
"An increase in the excise duty on cigarettes raises firms' cost of supplying each unit, shifting the supply curve upward by the amount of the tax. Because smoking is habit-forming and cigarettes have few close substitutes, demand is price-inelastic, so price rises by a relatively large amount while quantity demanded falls proportionately less. Consumer expenditure rises, and tax revenue is large because the quantity taxed barely falls. However, the same inelasticity limits the cut in consumption: smokers keep buying at the higher price. The effect should grow in the long run, as demand becomes more price-elastic. The tax is therefore more effective at cutting consumption when combined with non-price measures, such as public education, that reduce demand itself."
The paragraph does not divide the tax between buyers and sellers, because incidence is not required; it works through the outcomes the syllabus names. The diagram itself, a supply shift against a steep demand curve, is constructed step by step in the diagram atlas. At the macro level, the syllabus requires "Knowledge of the Marshall-Lerner condition", which links trade elasticities to exchange-rate policy, covered in the Singapore macro policy guide.
What Are the Five Classic Elasticity Errors?
Five errors recur in elasticity answers — sign confusion, using absolute instead of percentage changes, confusing PED with slope, mixing the point and mid-point methods, and calculating without interpreting — and all five show up in the working, so always show it.
- Sign confusion. Reading a PED of −2 as "less than 1", or dropping the sign on YED or XED.
- Using absolute changes. Dividing a fall of 100 cups by a $1 rise gives 100, which is not an elasticity. Both changes must be percentages.
- Confusing PED with slope. On a straight-line demand curve the slope is constant but PED is not. The bubble tea demand above fits the line quantity = 1,200 − 100 × price. Between $4 and $5 PED is −0.5. Between $8 and $9, on the same line, quantity falls from 400 to 300 (−25%) for a 12.5% price rise, so PED is −2.0. Same slope, opposite classification.
- Point versus mid-point method. The simple method divides by the starting value; the mid-point method divides by the average of the two values. For the bubble tea example the mid-point method gives −13.3% ÷ 22.2% = −0.6 rather than −0.5. The 9570 syllabus does not specify either method. Follow your school and show the formula used.
- Calculating without interpreting. State the classification and draw the consequence for revenue, expenditure or policy.
Elasticity sits early in the syllabus, in Theme 2, and gaps in it carry into later topics and into the year-end results that decide JC1 to JC2 promotion. Subject choice is covered in the JC subject combination guide.
Common Questions About H2 Economics Elasticity
Do you need to calculate elasticity in the H2 Economics A-Level exam?
You should be ready to. The 9570 syllabus lists the four elasticities as concepts and requires candidates to interpret information presented in "textual, numerical or graphical form", so a case study can supply prices and quantities. SEAB-approved calculators are allowed in both papers.
Is PED written as a negative or a positive number?
The calculation gives a negative number, because price and quantity demanded move in opposite directions. Many textbooks and JCs then drop the sign and compare the absolute value with 1. The syllabus does not state a convention. Follow your school, state the convention once, and never drop the sign on income or cross elasticity.
What is the difference between PED and PES?
PED measures how quantity demanded responds to a change in the good's own price; PES measures how quantity supplied responds to the same change. PED depends mainly on substitutes and habit; PES mainly on time and spare capacity.
How does PED change the effect of an indirect tax in H2 Economics?
Through price and quantity, not through ‘incidence’: the 9570 syllabus states that knowledge of incidence in relation to taxes and subsidies is not required. Analyse a tax through the new equilibrium price and quantity, consumer expenditure, producer revenue and the surpluses, then use PED and PES to explain their size — for a given supply curve, the more price-inelastic demand is, the more the price paid rises and the less quantity falls; the more price-elastic demand is, the more quantity falls and the more producer revenue (net of the tax) falls.
How can my child get help with H2 Economics elasticity?
Ancourage Academy runs JC2 H2 Economics alongside the JC1 class, and an overview of all its JC Economics tuition. A trial class (usually $18) starts with a short diagnostic on calculation and interpretation, to see which of the five errors, if any, applies.